
Accurate measurements reduce analysis time and increase confidence.
millimeter wave, 5G, 4G, LTE, ISM bands, Cellular, Bluetooth, RFID, GPS, LoRa, Zigbee, Servicing all frequencies and markets
Home »Measurement and Testing Services
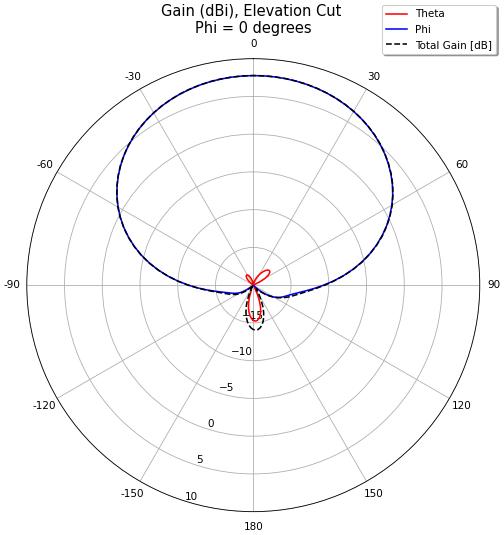
2D Pattern Plots
2D patterns have a higher degree of precision or resolution vs 3D patterns. Cuts usually come from the phi and theta planes which correspond to the E and H planes. These types of plots are well suited for directional antennas but can be used for any.
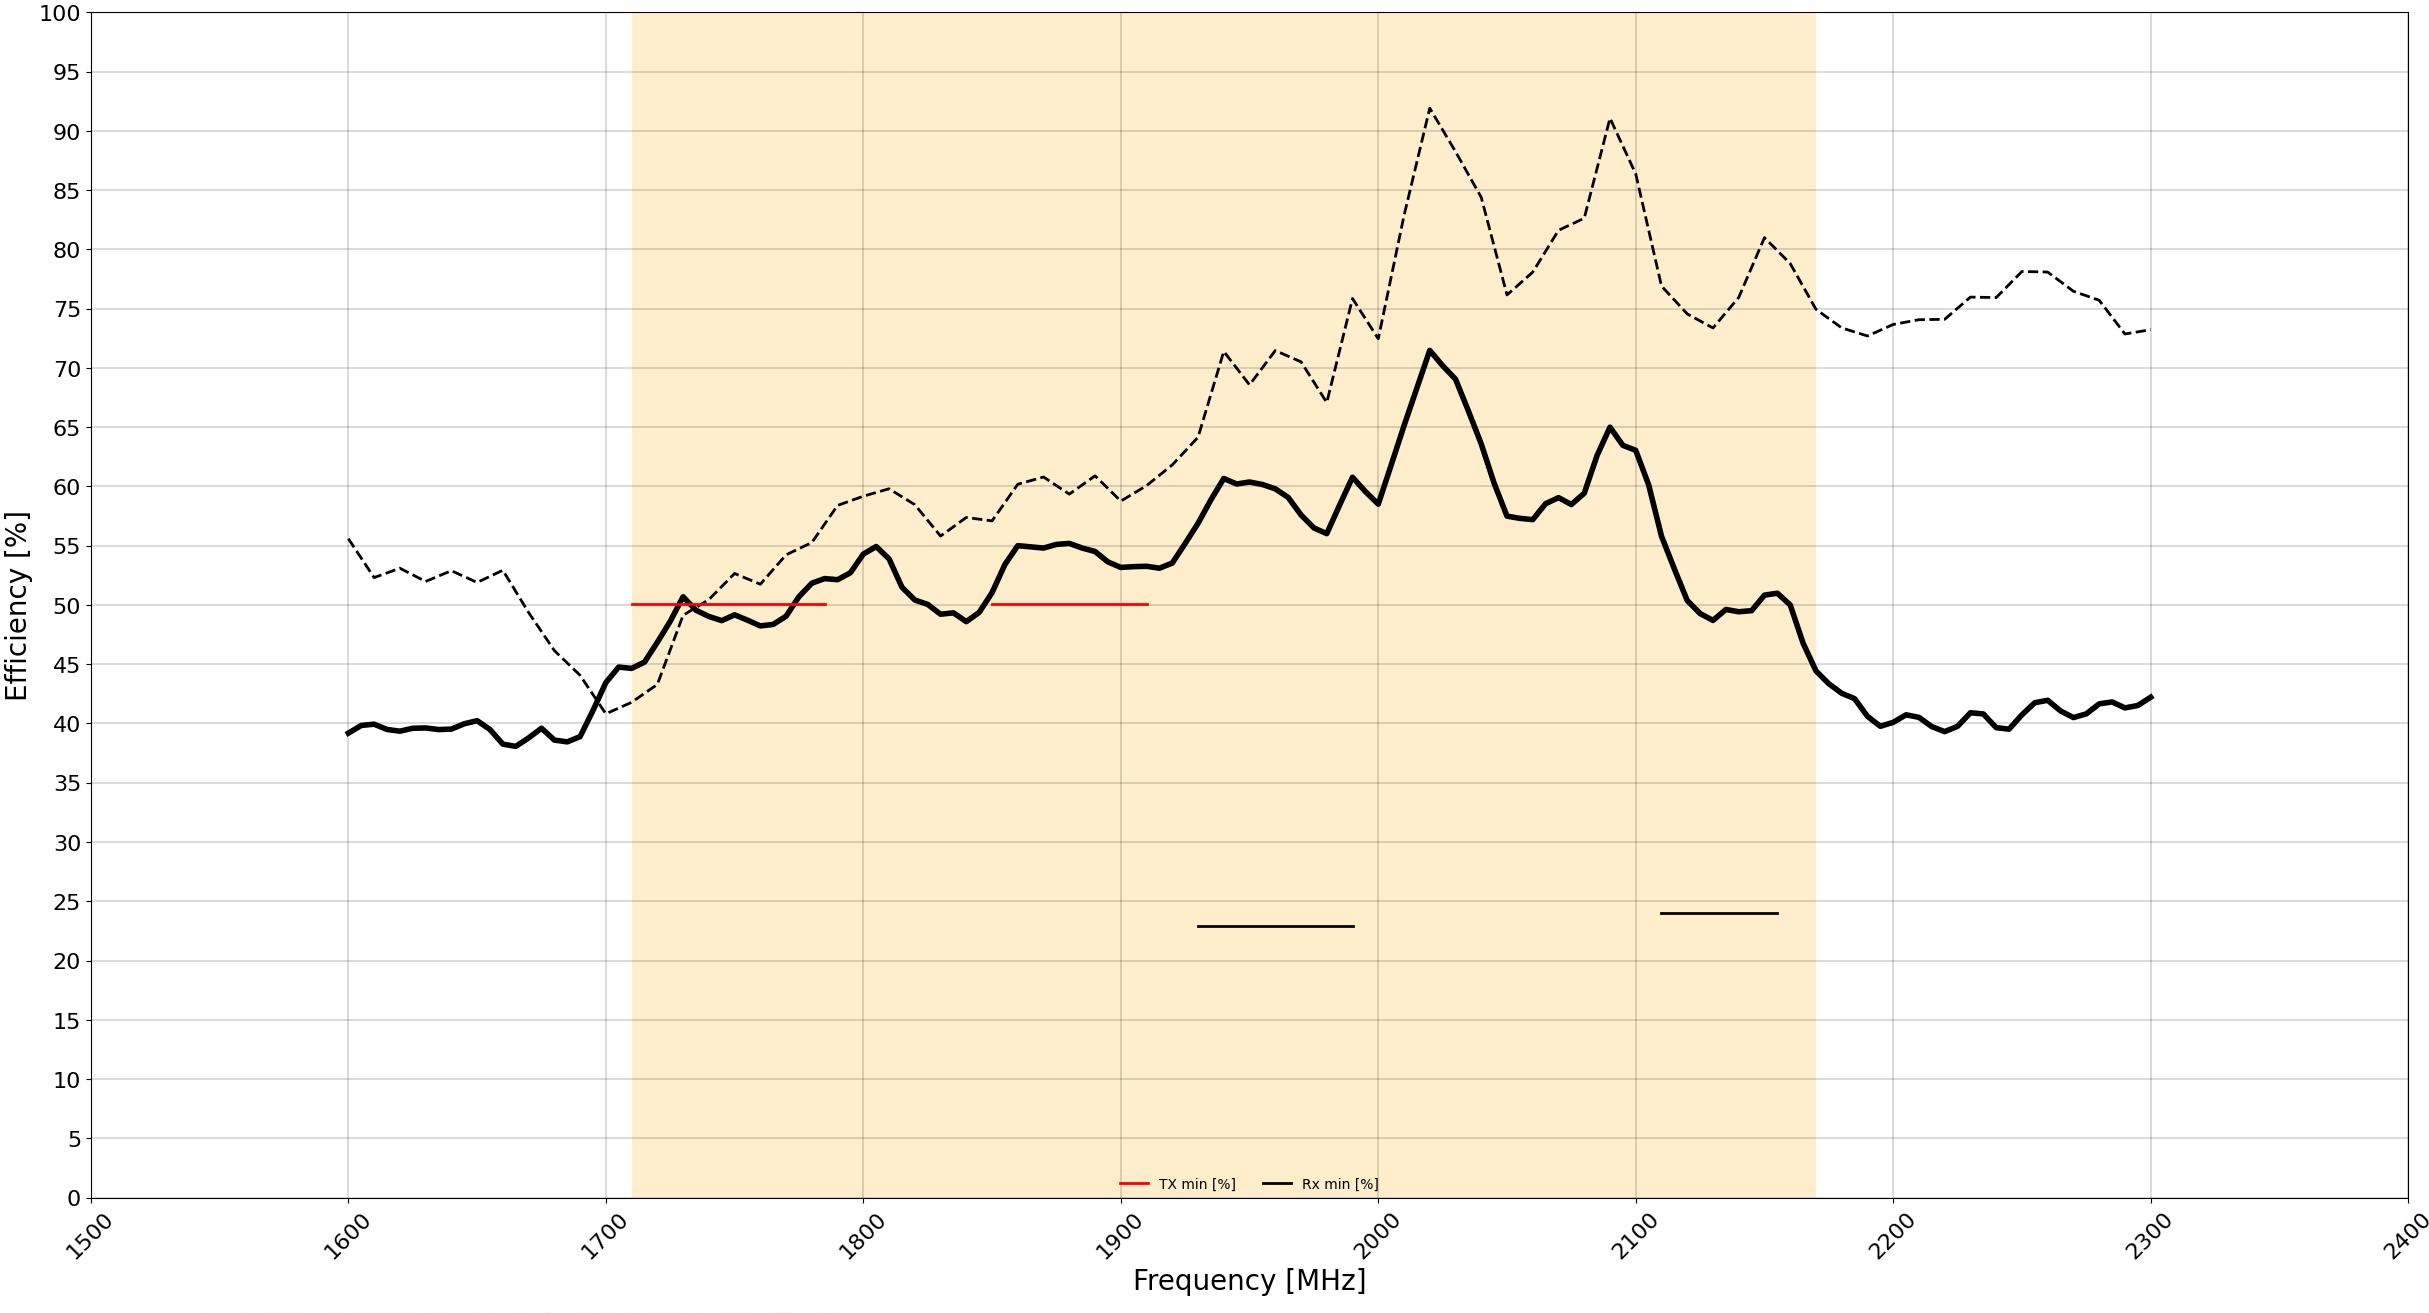
Antenna Efficiency Plots
Antenna efficiency plots are based on the integration of measured points over a sphere for specific frequencies. Here we can calculate your carrier minimum requirements and determine if the antenna design and radio will meet those minimums.
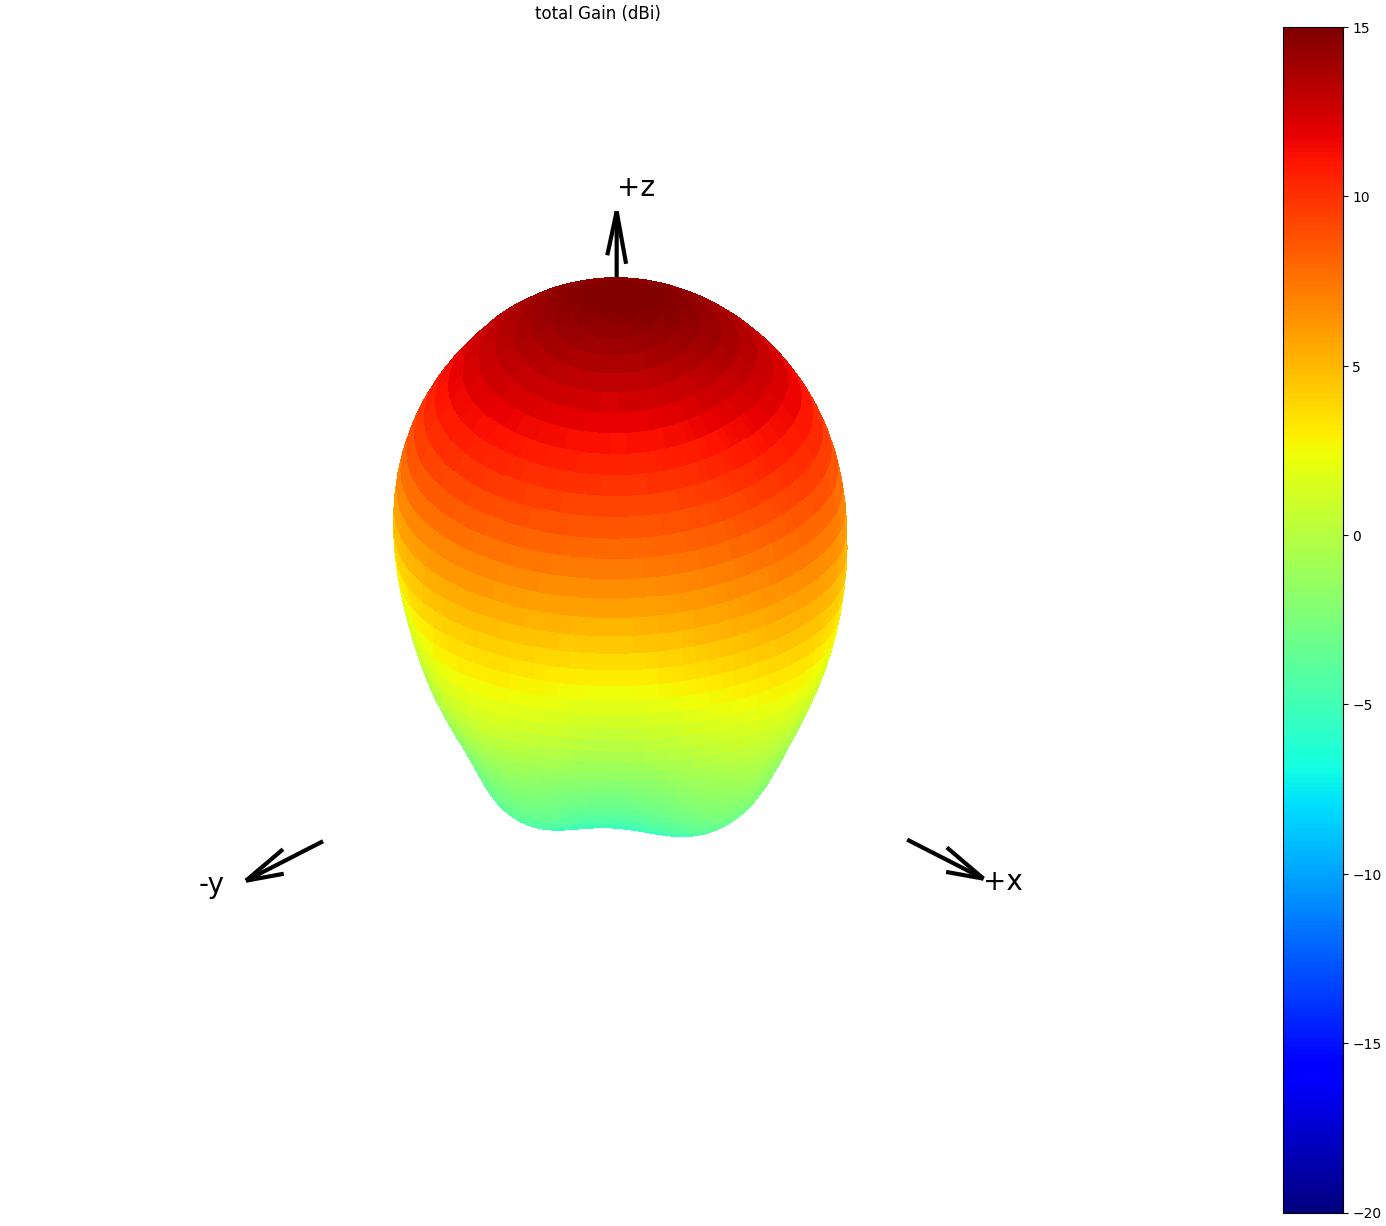
3D Gain Plots
3D gain patterns have lower resolution than 2D patterns but offer a visual representation over the entire sphere. These plots are better suited for non-directional antennas to reveal null zones and directionality.
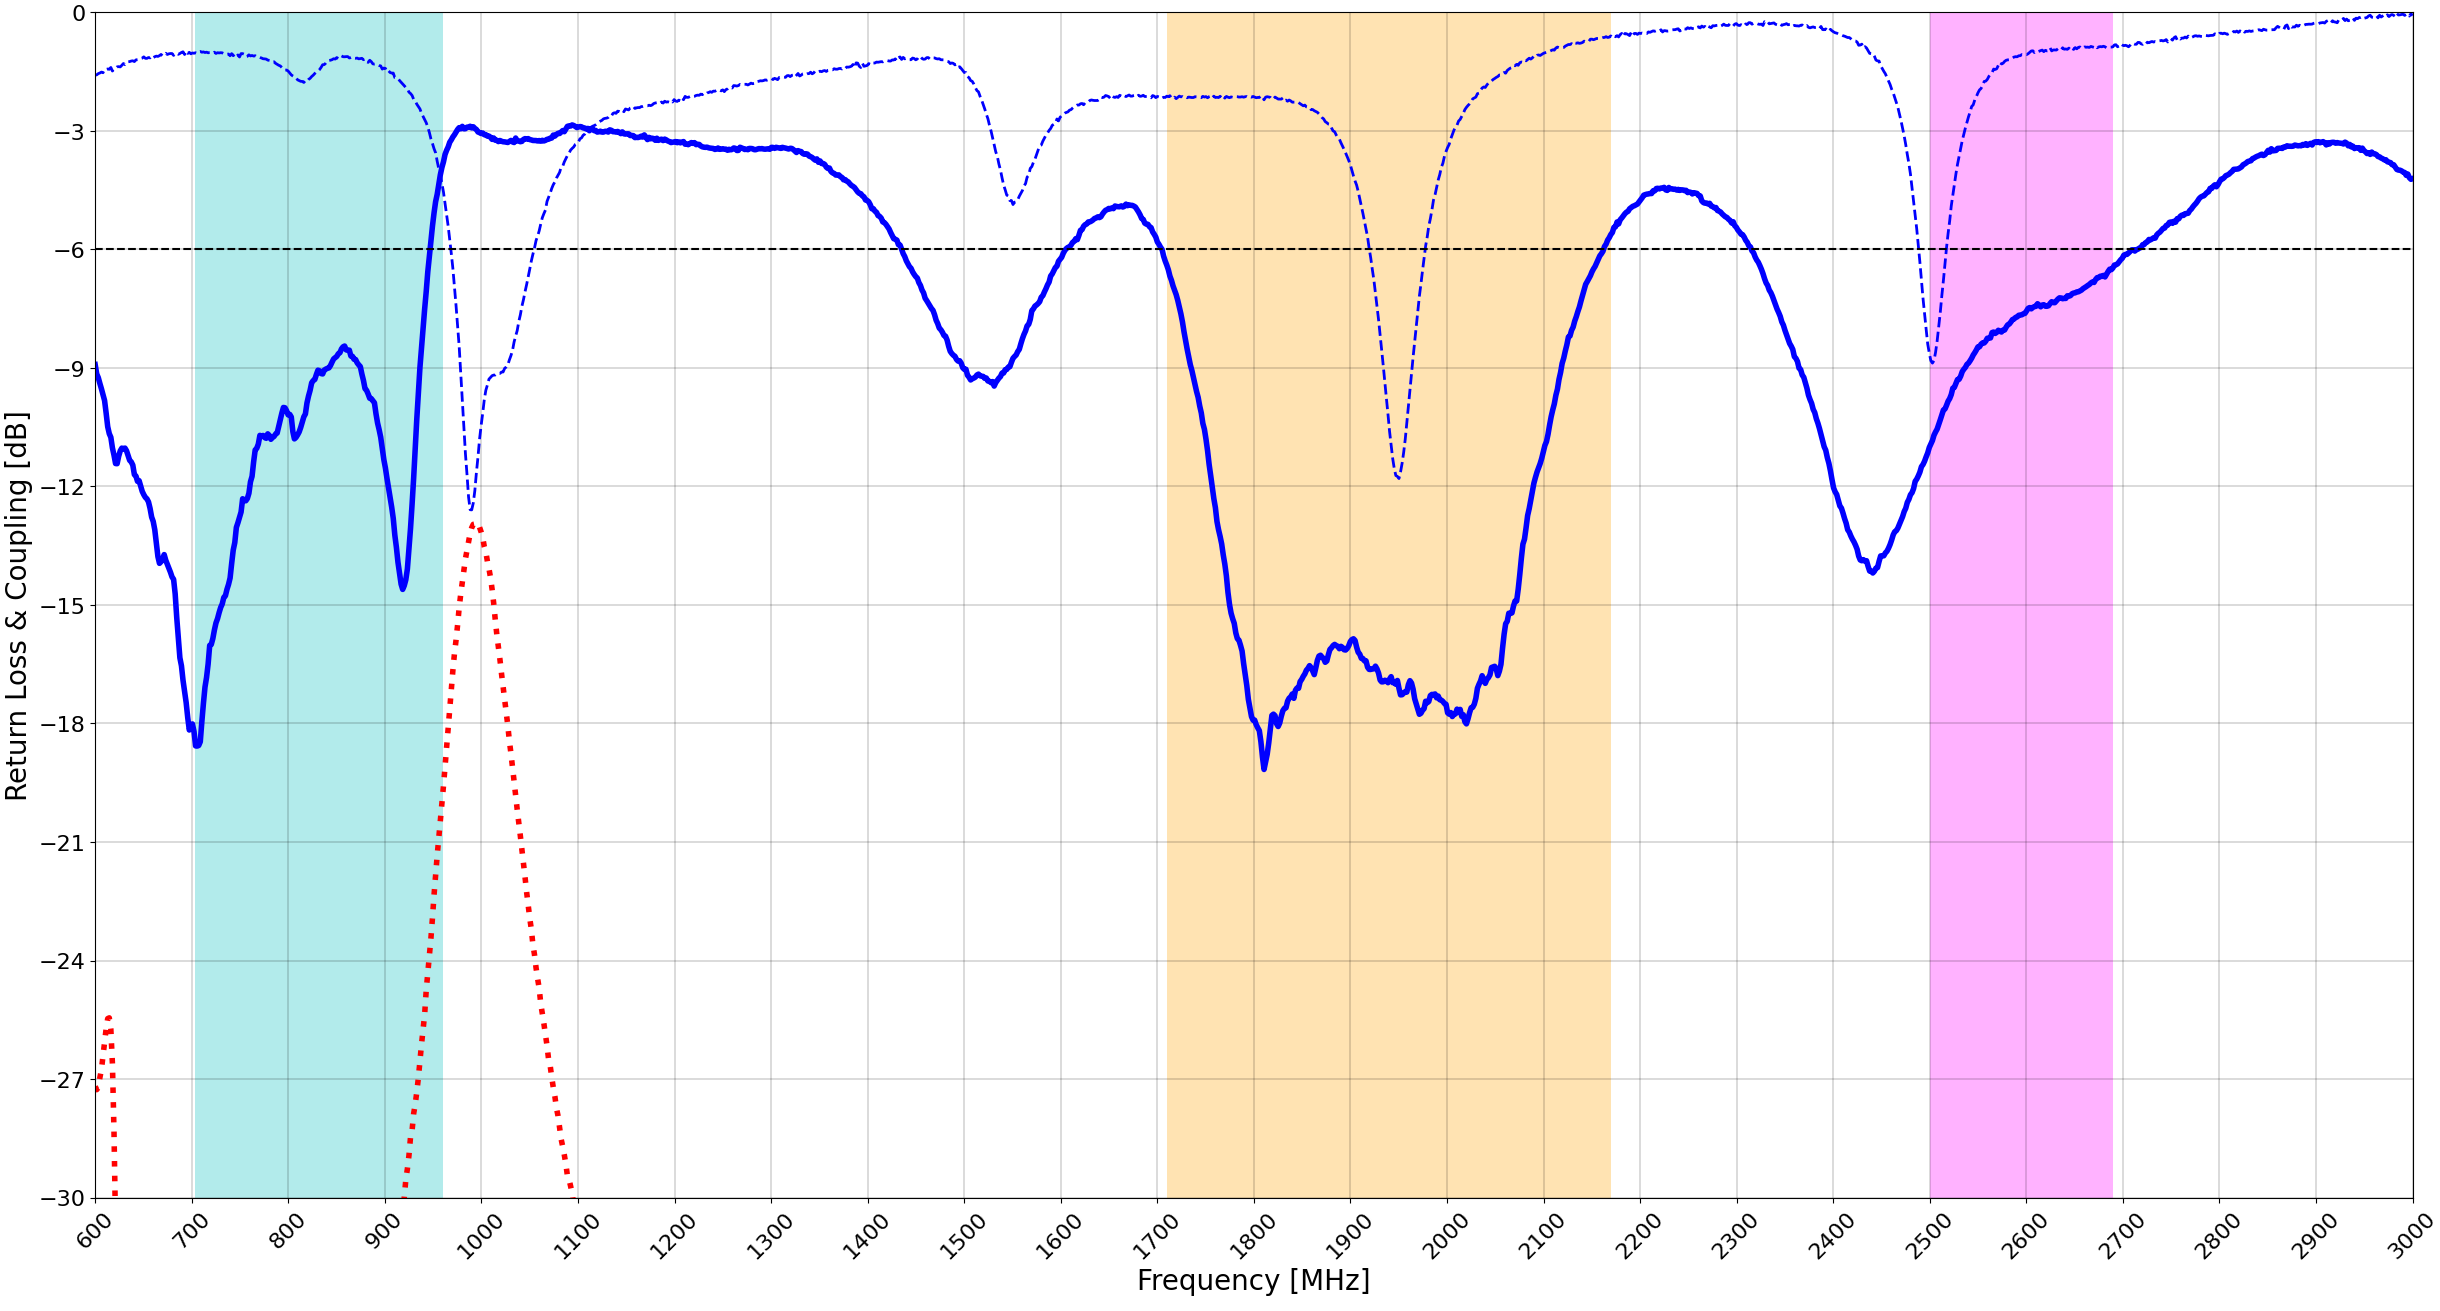
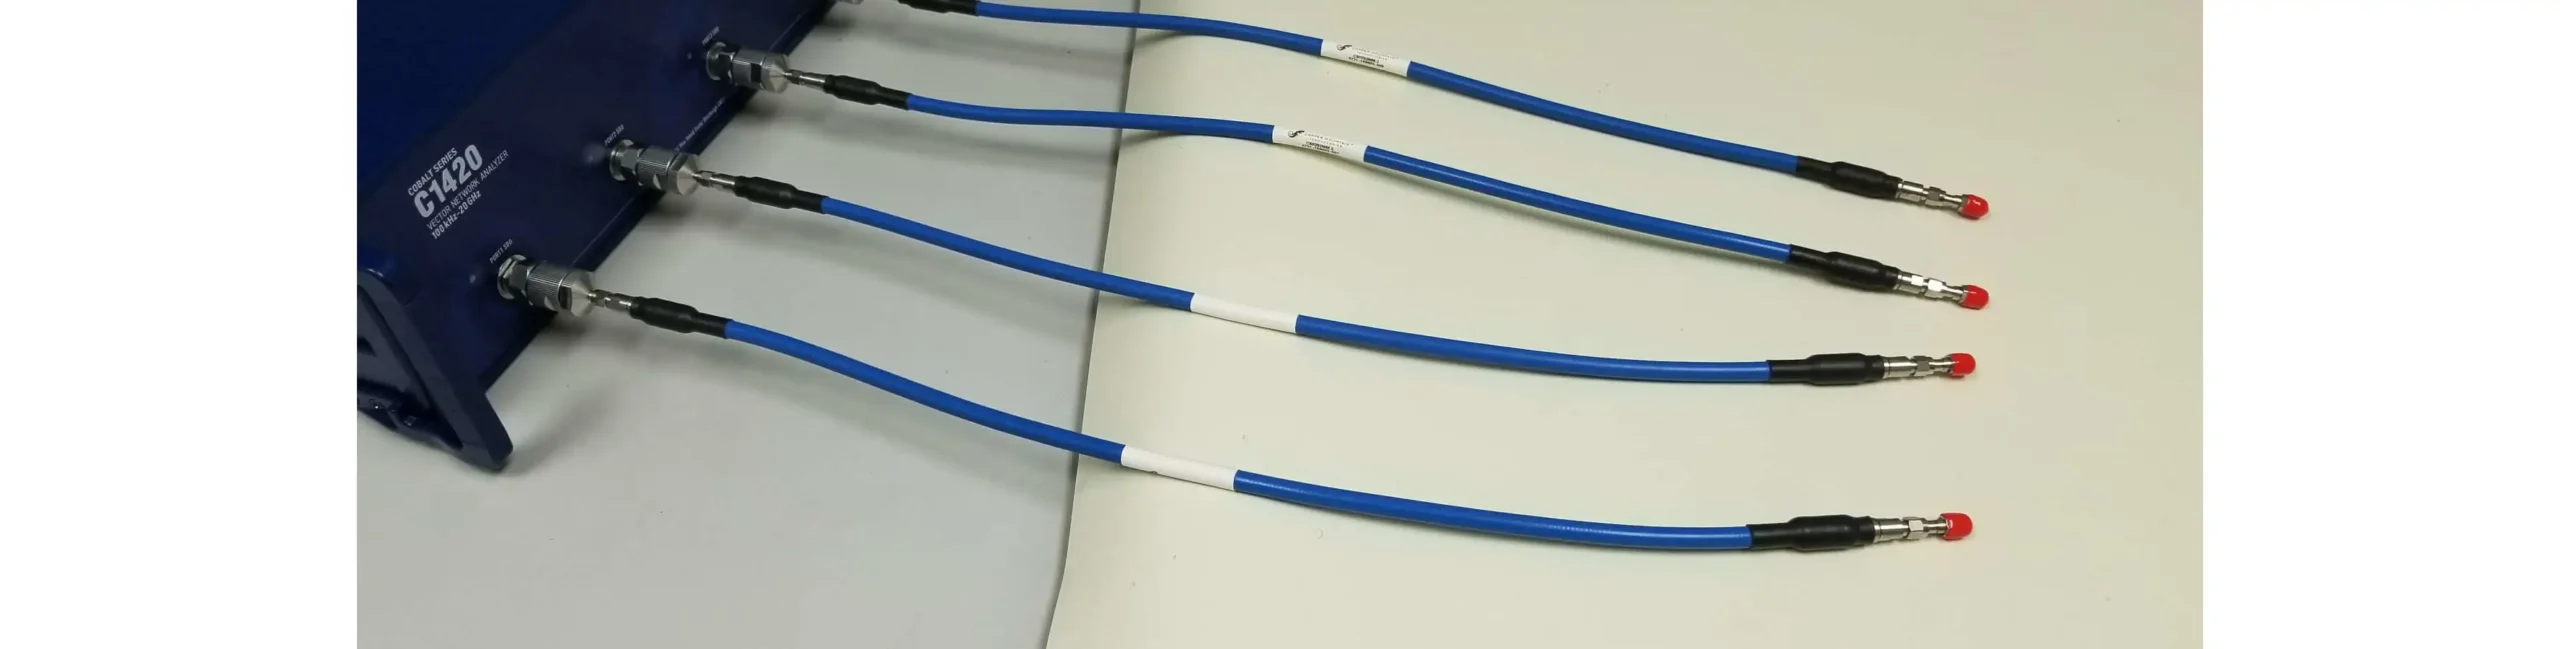
Return Loss and S-Parameter Plots
Scattering parameters or S-Parameters plots are the bread and butter for antenna design. During the design process vector network analyzers (VNAs) are heavily used to determine power metrics and assist in the iterative process. These types of measurements are usually the starting point and precede efficiency and pattern plots.
Project Specific Reports
Our reporting structure is designed to move along with your project. As device specifications change our reports will reflect with those changes. Included will be identification of mechanical structures and constraints, physical or electrical modifications followed by comparison plots and radiated performance metrics.
More importantly we are cost-centric, a driven strategy allowing you to choose which metrics to measure and facilitate project momentum. See an example page below.
